System Visualization: Map Your Mess
Cluster, Distill, Sketch, and Engage
Abstract
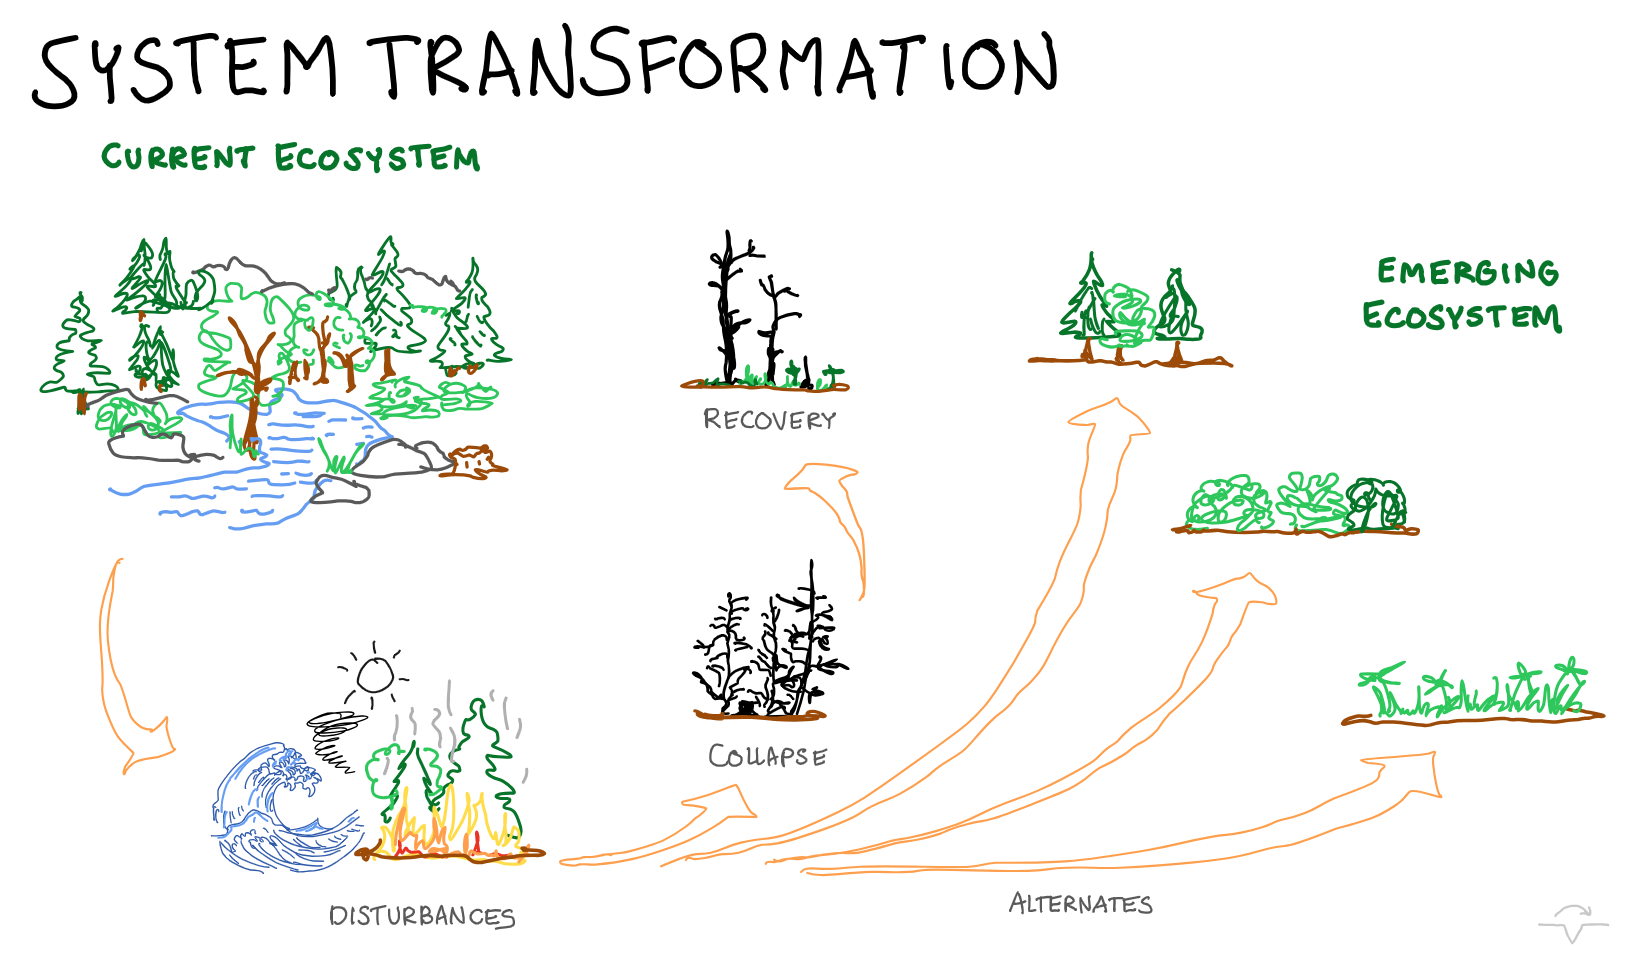
The purpose of this session is to explore how visualization can support both individual and collective system transformation.
For over 25 years, I've helped teams and organizations find clarity around complex challenges — by drawing out ideas, sketching concepts, mapping supply chains, and visualizing strategies and visions. I will share examples of how sketches and visualizations have catalyzed dialogue and change:
- Supporting conflict resolution between Israelis and Palestinians
- Helping children in dysfunctional families imagine better futures
- Bringing clarity to Ukrainians finding balance in a new country
Over time, I've come to appreciate both simple sketches and complex visual frameworks - and I believe that everyone, young and old, can benefit from a kind of visual literacy: the ability to sketch our own and shared system maps to better understand and transform the complex systems we live in. Join this session if you want to connect the dots between simple sketches for personal clarity and larger visual maps for teams, organizations, and communities.
This session will not be recorded.
Speaker Bio
Ole Qvist-Sørensen
Ole Qvist-Sørensen is a Danish visual facilitator, founder of Bigger Picture, and co-author of "Visual Collaboration." With over 15 years' experience, he empowers people worldwide to harness visual thinking in their personal and professional lives—from learning and reflection to collaboration and transformation.
Session Summary
This session was not recorded. Ole explained how maps have changed over time as our understanding of geography evolved. Maps in the past represented not so much geography, but kingdoms as people imagined them. Later, with the discovery of the Americas, Ole showed maps that only included parts of the New World that were already discovered.
Through the example of a Tube Map from London, he highlighted how maps not only represent reality, but they collapse the time of how fast you can get from one point to another.
He argues that it is ever more important how to make maps. Through the example of Google Earth zooming in to an office in Copenhagen, he stressed that it is important to learn to know when to zoom in and when to zoom out.
Maps provide a different perspective, he demonstrated this idea through the "Earth Rise" photo from the surface of the moon - what we can see from afar.
Through the example of one History teacher who placed a big timeline on the wall and asked students to mark everything they know so he won't have to teach them what they already know. Through this exercise the teacher also learned points where understanding was weak or incorrect. Building on this example Ole suggested visualizing an experience such as drawing a line and putting pearls on the line to capture what has happened throughout the schoolyear. This is an approach to capture quality instead of quantity. (My own reflection on this, is how the same approach could be used for journaling. Instead of taking notes, creating a visual line summary of a week/month/year).
Ole suggest that collaboration through presentations and bullet points is outdated and slow, instead using Visual Thinking, Visual Practice and Visual Frameworks creates an environment of Broad brain bandwidth collaboration, quoting the saying: "A picture is worth a thousand words". Visual approaches are faster, create deeper alignment and are suitable for understanding complex systems.